The next plot shows change against income, which shows that reductions only occur above an income of £35,000

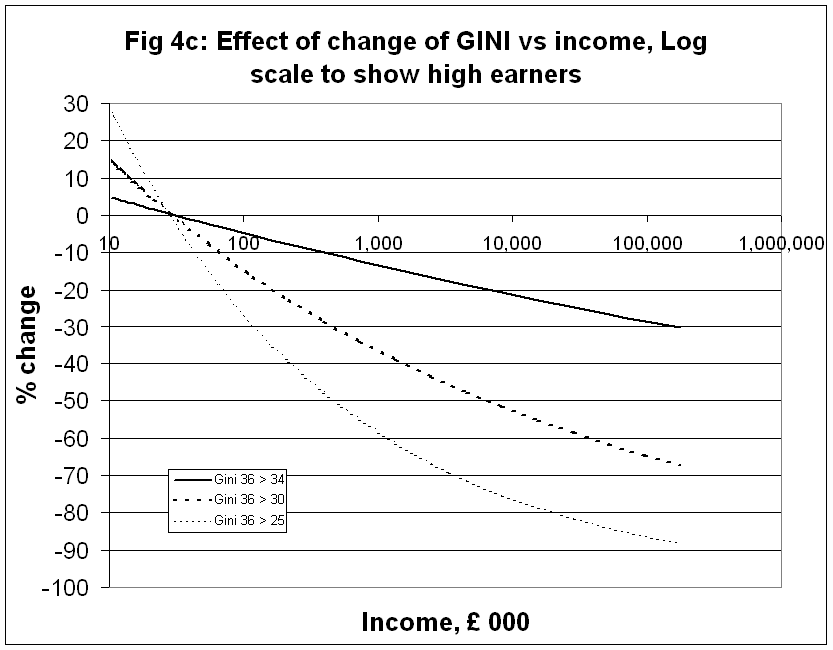
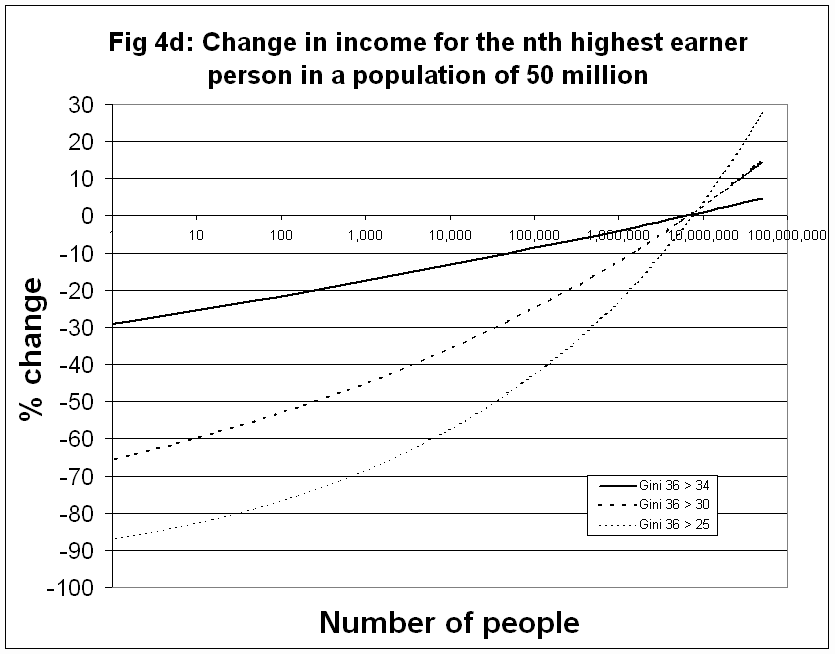
The next two plots have a logarithmic scales in order to see what happens to very high incomes.
These estimates are made on the assumption that income distribution is smooth. This means that, for any particular income level, the number of people in the next higher level will be smaller by proportion that hardly changes throughout all the levels. This sort of distribution is known as a power law and is ubiquitous in nature. It appears that income distributions also fit this law.
I generated some power law distributions with specific Ginis, for example for 36% and 34%. I then looked at the difference between the two curves and calculated the change in going from a particular position on one to the corresponding position on the other. The results are shown below in a set of graphs and summarised in the following table shows how incomes would change for proportions of the population:
| Gini 36% > 34% | Gini 36% > 30% | Gini 36% > 25% | |
| Significant gain, >10% | 0% | 44% | 68% |
| Modest gain, 3% - 10% | 52% | 35% | 13% |
| Insignificant change, Less than 3% | 45% | 12% | 7% |
| Modest loss, 3% - 10% | 3% | 6% | 5% |
| Significant loss, 10% - 30% | 0.1% | 3% | 7% |
| Major loss, > 30% | 0 | 0.1% | 1% |
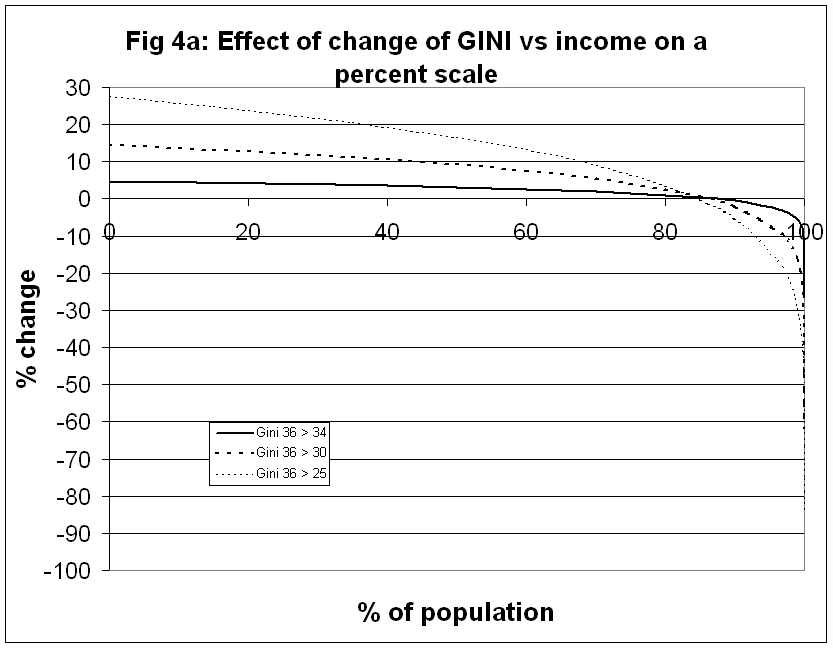
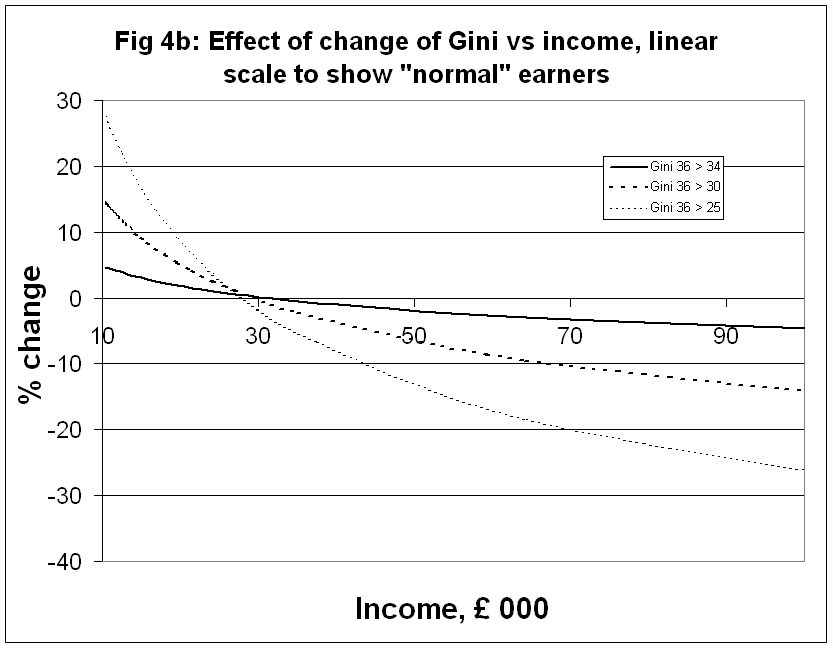
The graphs below which show the percentage change at any income level. To overcome the problems of illustrating an extremely non-linear relationship there are four graphs showing the same data but plotted on different horizontal scales.
The first plot shows that about 85% of the population will see some increase in income.

The next plot shows change against income, which shows that reductions only occur above an income of £35,000
The next two plots have a logarithmic scales in order to see what happens to very high incomes.

